
There are many ways to run a server log analysis but each analyse requires a long data preparation step: logs recovery, grouping them, split data in several columns, cleaning, etc. These treatments can seems really hard, especially if there are done manually…
In this technical guide, I will show you how to do all these steps quickly and exploit the logs of an OVH web hosting with Dataiku, a Data Science tool.
This tool is a small revolution in the data processing field and you will soon understand why.
I forgot…
There is a FREE version of Dataiku that has the added advantage of being installed locally so that the data remain on your machine.
Contents
- Chapter 1 : Getting Started with Dataiku DSS for Logs Analysis
- Install Dataiku DSS
- Connecting OVH server logs to Dataiku
- Your first analysis
- Chapter 2 : Preparing logs for SEO analysis
- Cleaning server logs
- Filter search engine spiders and robots (GoogleBot, BingBot, etc)
- Chapter 3 : Advanced Log Analysis for SEO
- HTTP Status code and crawl errors
- Crawl frequency per URL
- Crawler behaviours on mobile and AMP pages
- Screaming Frog Crawl + Server log Analytics
- How does your website influence crawlers? Find your own correlations
PART 1 : Your first server log analysis with Dataiku
Install Dataiku DSS
Start by instaling Dataiku DSS on your computer : https://www.dataiku.com/dss/trynow/
Connect you OVH logs to Dataiku
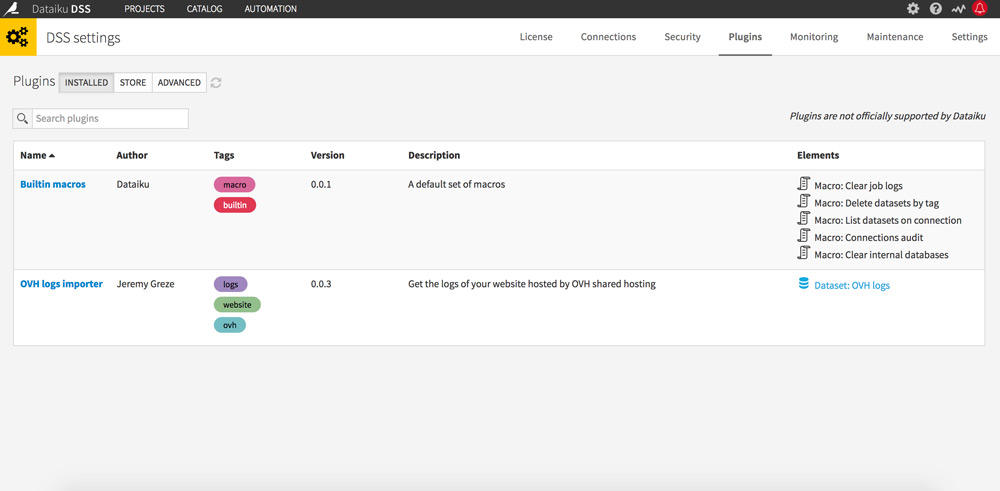
Go to administration (gear icon to the top right), then in the Plugins tab.
Search for the OVH Logs Importer plugin (by Jérémy Grèze) and install it.
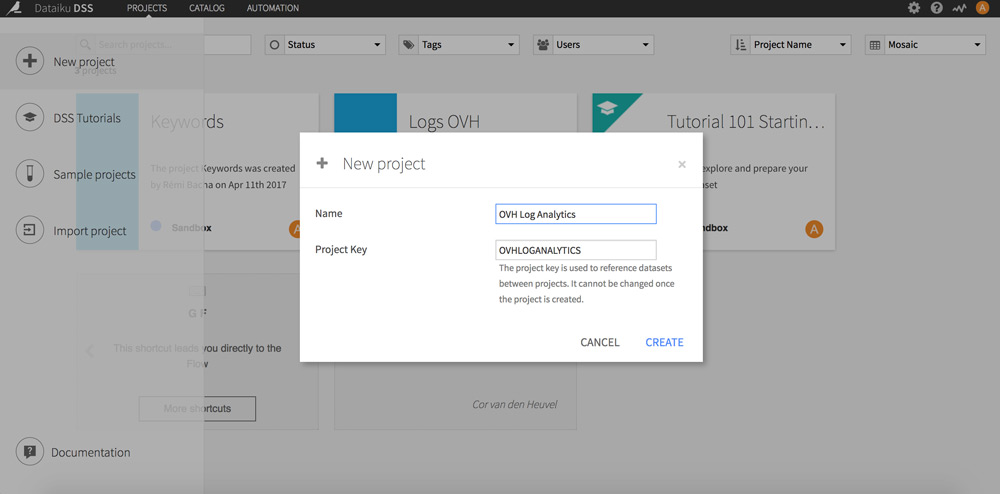
Go back to the home page and click on + to the top left. Chose “New Project”.
Click the “+ Import your first dataset” button and select “OVH logs”.
A new page appears.
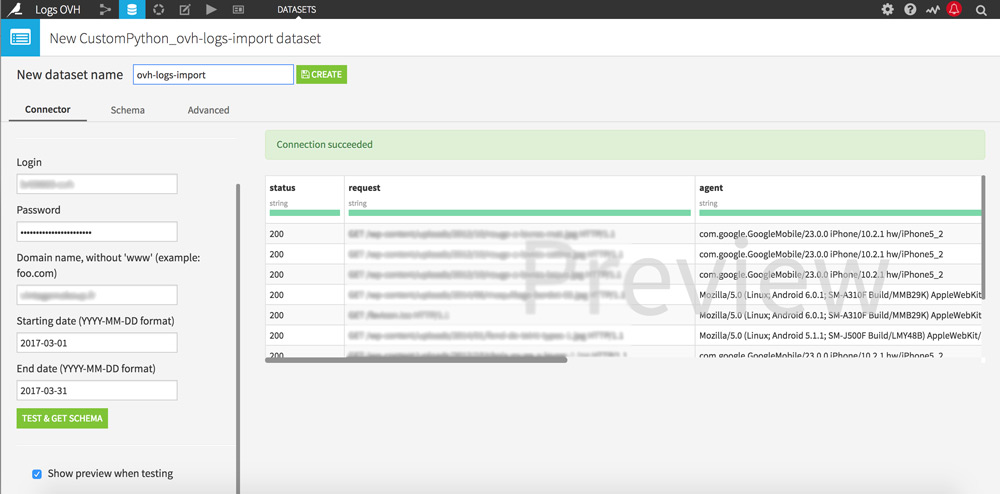
Fill in the fields with your OVH logins, the domain name you wish to study and the analysis period you are interested in. Then click on the “Test & amp; get Schema” button to start your server logs recovery.
Which period to study?
I advise you to study at least the last 30 days for a representative analysis. It will allow you, for example, to discover the pages ignored by Google Bot.
The analysis may take a few minutes depending on the period you have selected.
Once the recovery is complete, a sample of your logs appears on the right of the screen. As you can see, data are already well classified: magic! Give a name to your dataset and click the “Create” button at the top of the screen.
You will now be able to start analyzing the server logs of your website: analyze the traffic, check status codes encountered by visitors / Bots, etc.
We will start with some basic manipulations so that you can take Dataiku DSS in hand quickly.
Foreword: Dataiku DSS uses a sample of 10,000 lines to speed-up processing. You can enlarge the sample according to your computer’s capacities. You just need to click on 10 000 rows under Design Sample in the top left corner.
Your first analysis
On your dataset, click the LAB button at the top right. A pop-up appears, click on “NEW Prepare data and build models” to create your analysis.
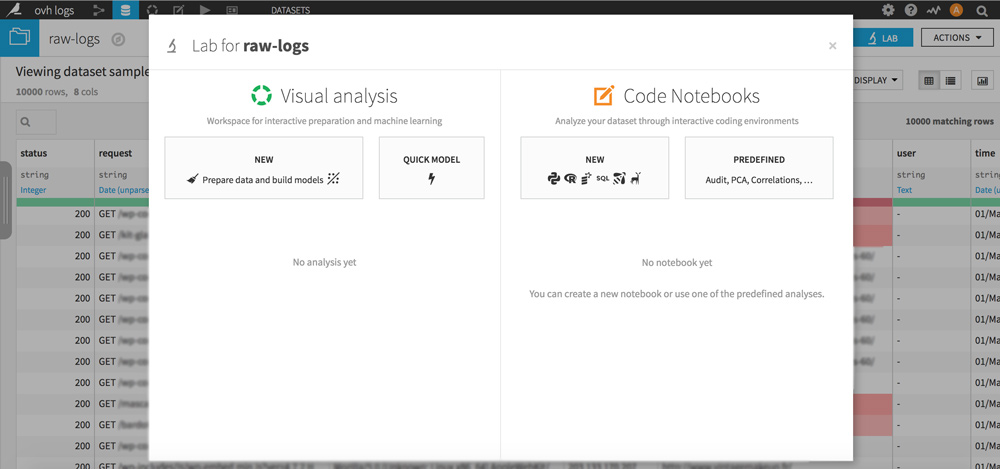
Click the green “+ ADD A NEW STEP” button and choose the library you are interested in.
You will have to repeat this operation each time I will talk about analysis creation.
Status code encountered by visitors
Click on the column heading “status” then on “Analysis …”. Congratulations you just made your first server log analysis!
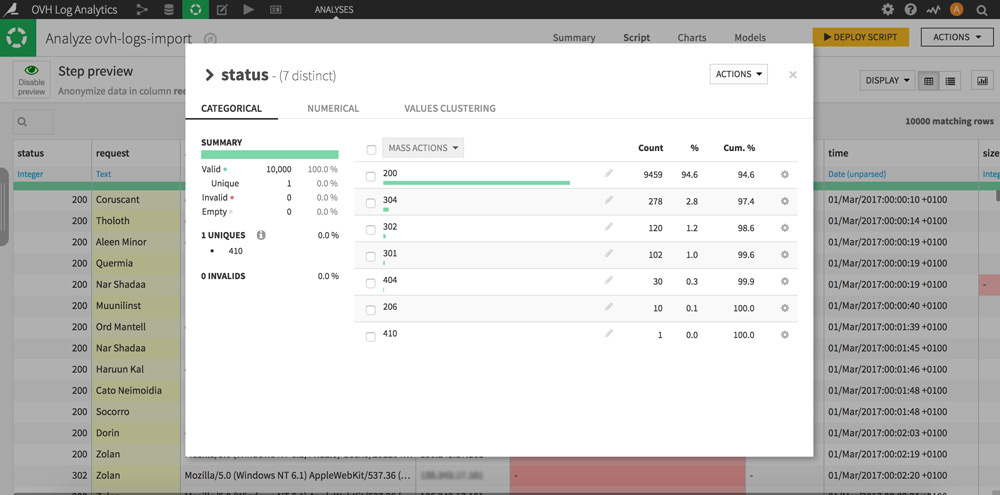
Very simplistic, but really interesting: here you have the distribution of all the status codes actually encountered by the visitors (humans and bots) of your site.
Tip: Clicking the gear icon of each line will allow you to perform processing in your dataset. For example, display only the rows that contain the status code 404 to prioritize your strategy.Visitor IP adresses geolocation
Dataiku DSS offers several ways to enrich your datasets via external APIs and databases.
Here we will enrich the IP addresses with geographical information: countries, regions, cities.
Click on the column heading “host” and then on “Resolve GeoIP”. 7 new columns appear.
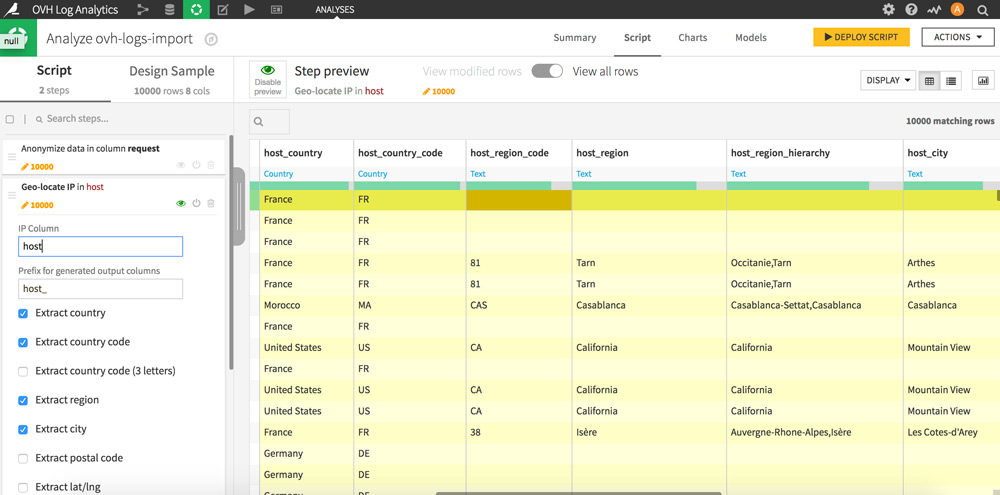
You have just geolocated all the IP adresses that have visited your site. You now know the origin of your visitors by country, region and city. To get an overview of the distribution of the geographical origin of the visits, click again on the heading of the column that interests you and on “Analysis …”.
Google Bot filtering in your server logs
Here’s the part that should most please SEO!
To filter Google Bot’s hits in the server logs there are 2 options:
The first one is to click on the column heading “agent” then “Filter” the character string “Googlebot”. This method has the disadvantage of capturing the funny people who pretend to be GBot … You want to know the full chains of Google’s user-agents, check this page.
The second method, that appears as more reliable, is to filter GoogleBot IPs by manually entering the 66.249 prefix (“host” column).
Once you have chosen your method, click “+ Add as a step” to validate the operation by following the same setting as in the screenshot below.
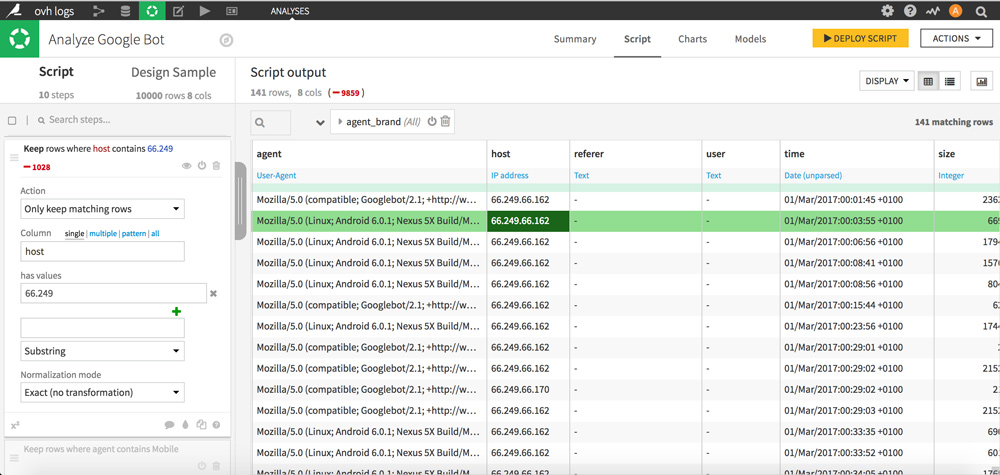
Only lines based on the Google Bot user agent remain.
This is a good basis for performing much more detailed and detailed analyzes of Google Bot behavior on your website: status encountered, crawled pages, and so on.
I hope you enjoyed these first “exercises”. Let’s move on to a log analysis for SEO but before that, let’s prepare data.
PART 2 : Web Server logs Preparation
Cleaning logs for an SEO analysis
The goal here is to keep only the most interesting web server logs for an SEO analysis. So we’ll remove the lines that concern css, js, images, etc.
Create a new analysis (as seen in PART 1 Your first analyzes) and choose the “Filter rows / cell on value” library in the “Filter data” set.
Then set the filtering of your logs as follows:
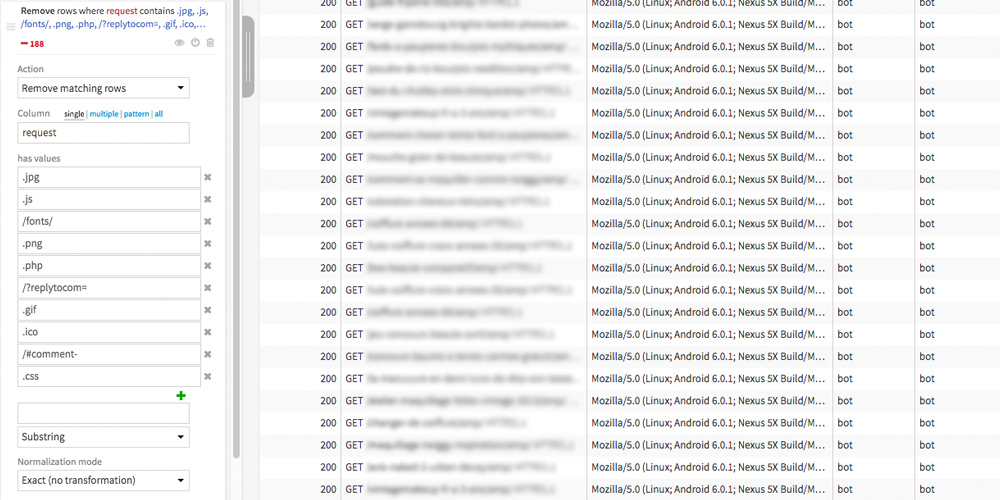
The values that has to be filtered may vary depending on the type of site you are analyzing. Here the values (“has values”) are particularly adapted to an analysis of a WordPress website but do not hesitate to check your dataset to complete them.
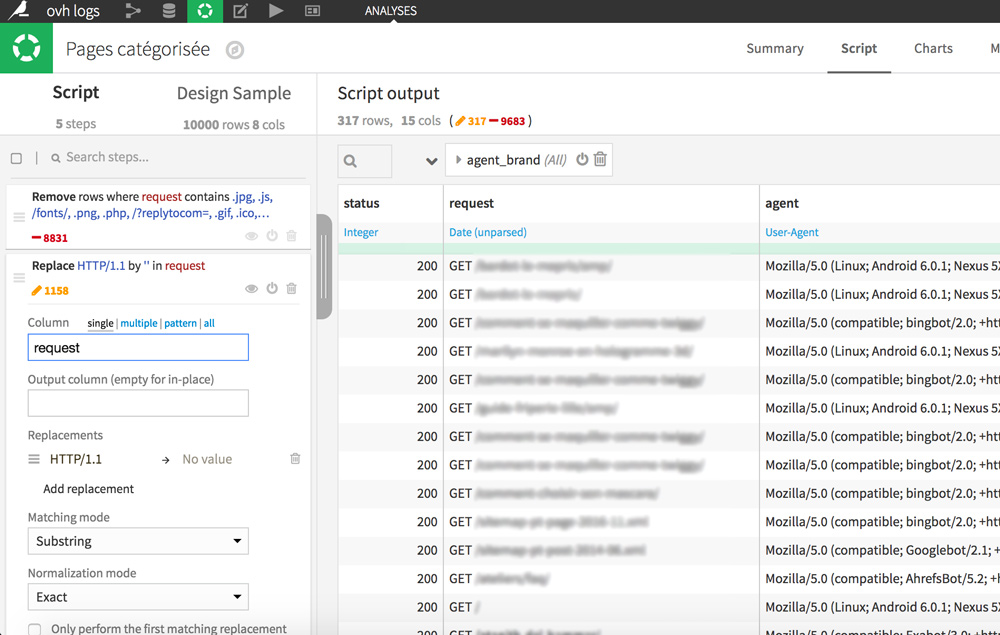
Finally for a better readability, we will remove the HTTP / 1.1 at the end of the queries.
In the request column, double-click on any cell containing HTTP / 1.1 and then select “Replace HTTP / 1.1 by …”
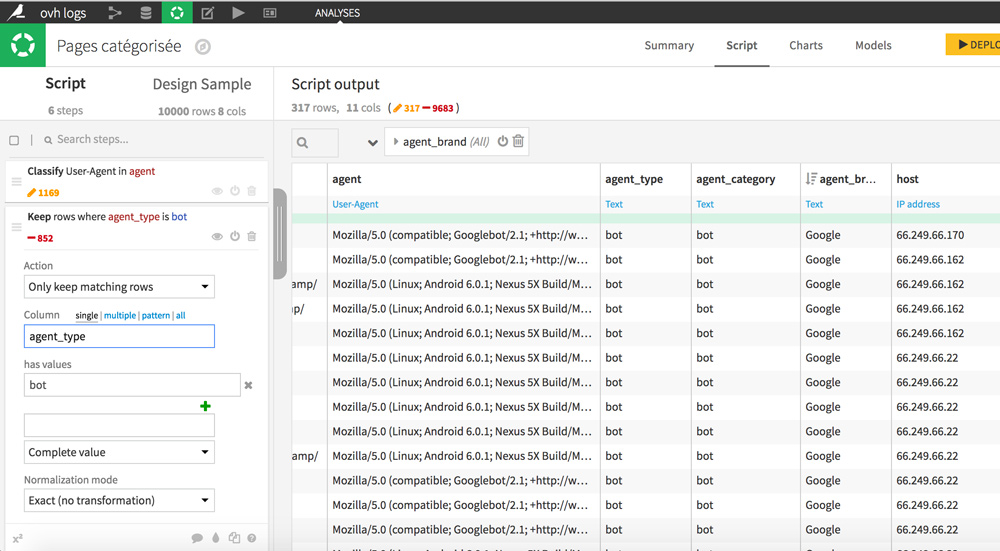
Filtering crawlers and bots: GoogleBot, BingBot, etc
Start by classifying user agents by type. Thanks to this, we will be able to keep only bots. To do this, click on the agent column header, then on “Classify user agent”. New columns appear with additional details: agent_type, agent_category, and agent_brand.
To only keep rows that concern bots, click a cell containing the “bot” value in the agent_type column, and then select “Keep only rows equal to bots.”
PART 3 : Advanced Log Analysis for SEO
In this part we will go further in studying crawlers’s behaviours: visits frequency, status codes encountered, behavior on mobile pages.
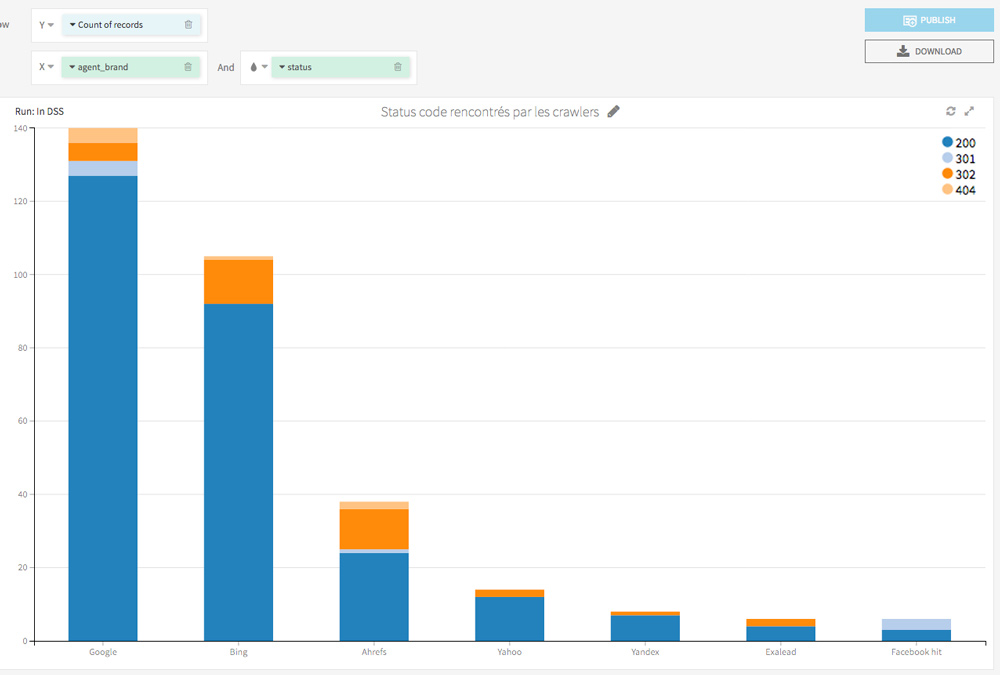
Status code encountered by bots
Go to the Charts tab.
On the left there are all variables your dataset includes. Drag them to the right part on X and Y to create a visualization of your data.
The first visualization is a macro view of the status codes encountered by the Bots: it regroups the number of visits of each bot on the site and the status codes encountered.
Do you like this kind of analysis?
Let’s go on!
Bots hits per URL and page type
Let’s now analyze in detail the number of hits for all the Bots on each of your URLs, in order to detect particular paterns. We will also classify the pages according to whether they are AMP or not.
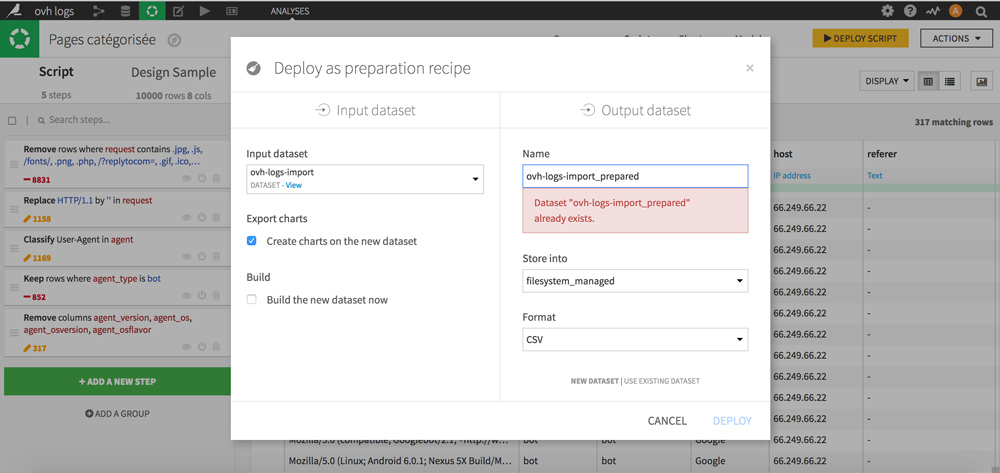
Start by creating a new dataset based on our previous treatments (filtering, cleaning). We will need it for grouping hits per URL.
To achieve this, click the DEPLOY SCRIPT yellow button at the top right. Name it, choose its location and format (CSV), and click DEPLOY.
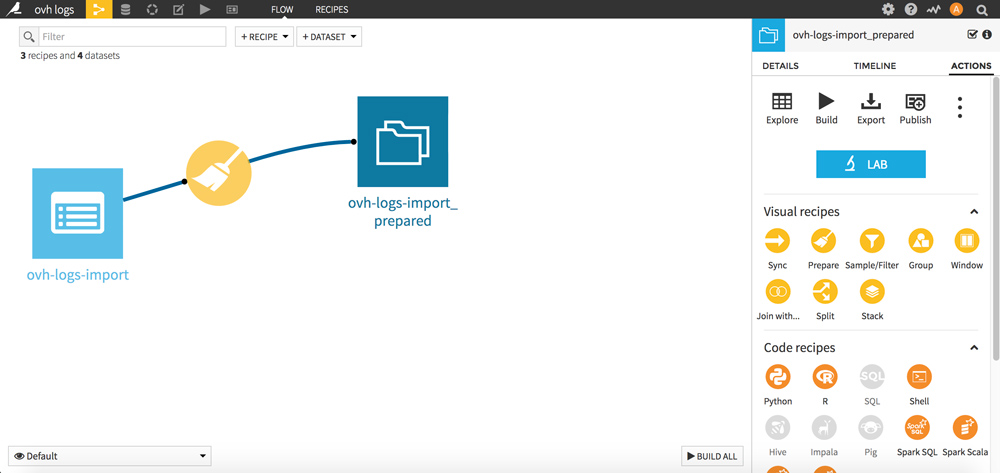
Is your new dataset ready?
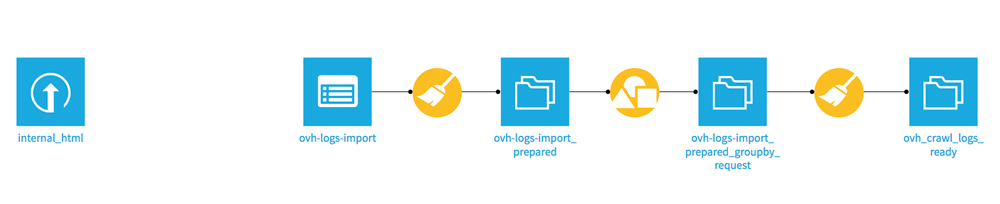
Go to the FLOW (Dataiku menu, top left). Consider the FLOW as a history of your operations.
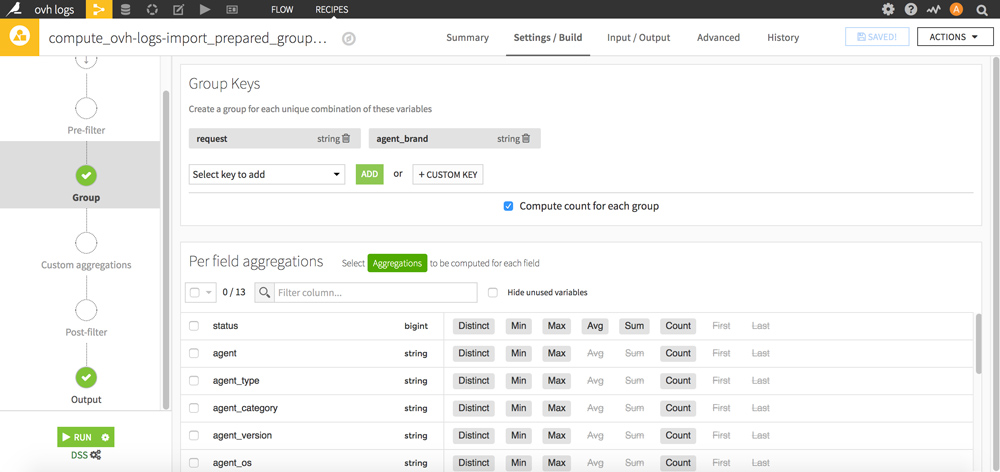
We will now regroup the lines per queries. The goal is to count the number of bots’s hits per URL.
Click on your new dataset, then in the Visual recipes section click on the yellow picto “Group”.
Select the Group Keys “request” and “agent_brand” then validate your new dataset by clicking the RUN button at the bottom.
Go back to the FLOW: your new dataset now appears. Click on it and then click the blue “LAB” button on the right.
A window appears: click on “NEW Prepare data and build models” to start a new analysis.
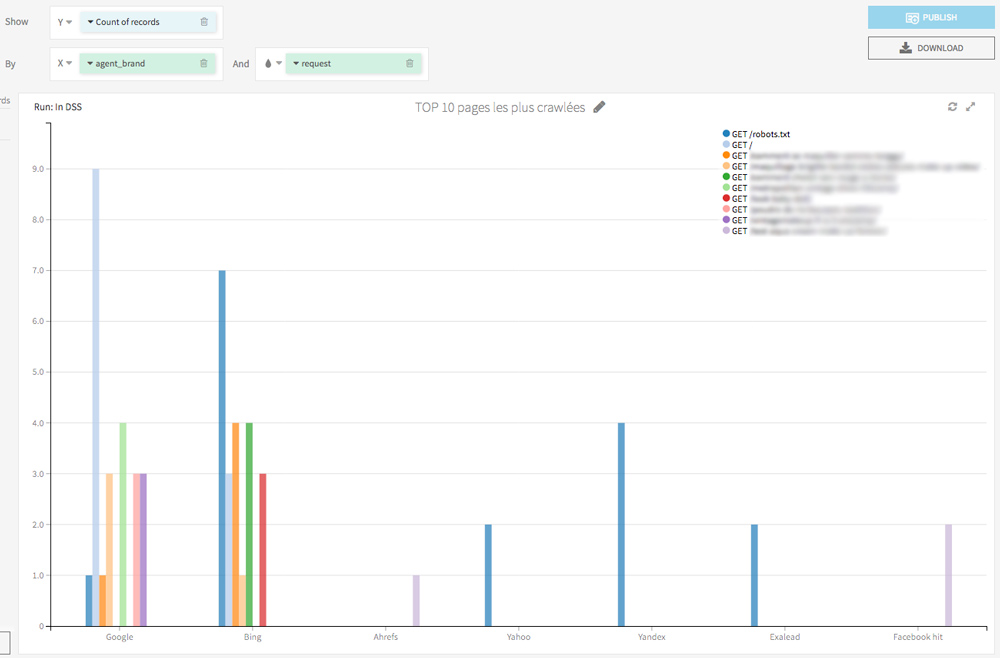
With a table view (Charts tab), you can generate an observatory of Bots’s hits on each URL, in a few clicks:
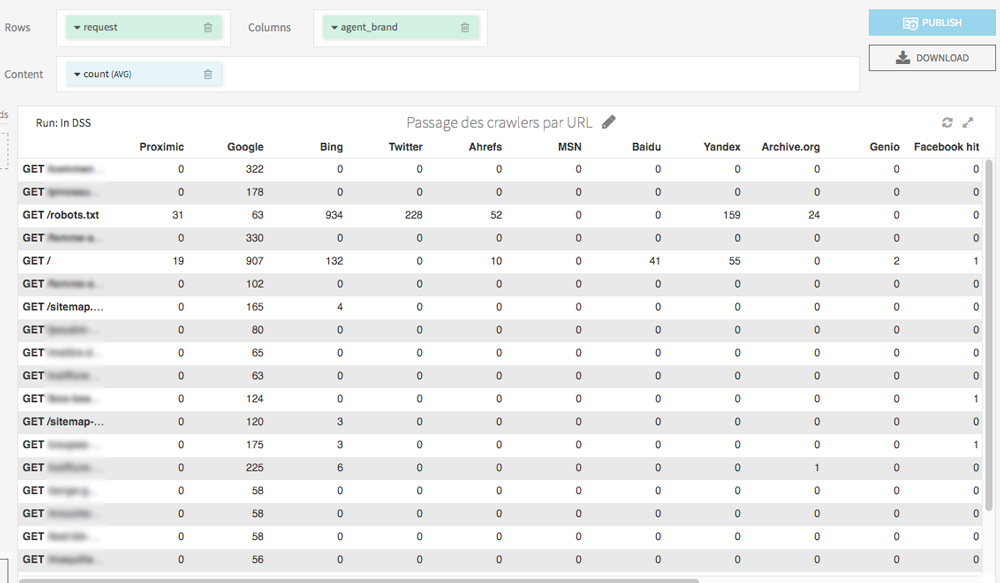
In the Charts tab, with few drag and drop you can easily display the pages most visited by crawlers.
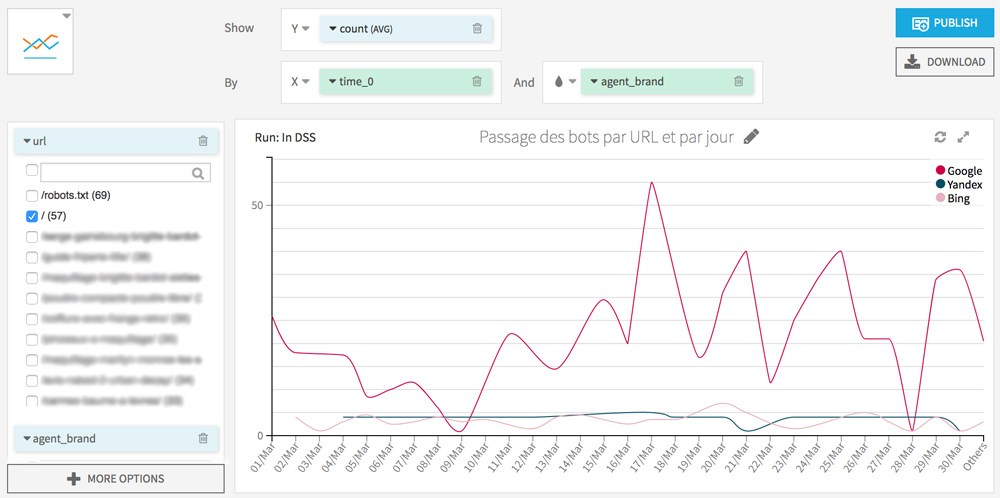
I also invite you to try a visualization of the hits per day for each crawler. This will allow you to discover abnormal behavior (eg a bot that suddenly stops visiting some of your pages) and also know the date of last crawl of your URL.
Bots’s behaviours on mobile pages and AMP
We will now split AMP and non-AMP URLs.
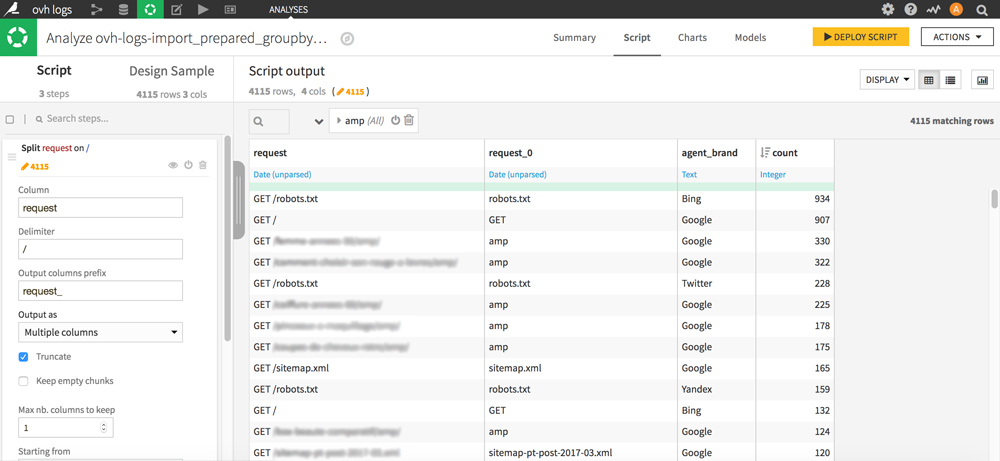
Cut the request column thanks to a Split with delimiter / and specify the name of the generated column (in Output columns prefix box). Choose Output as Multiple columns and check Truncate. Change the number of columns to keep to 1 and choose Starting from End.
You should get something like this:
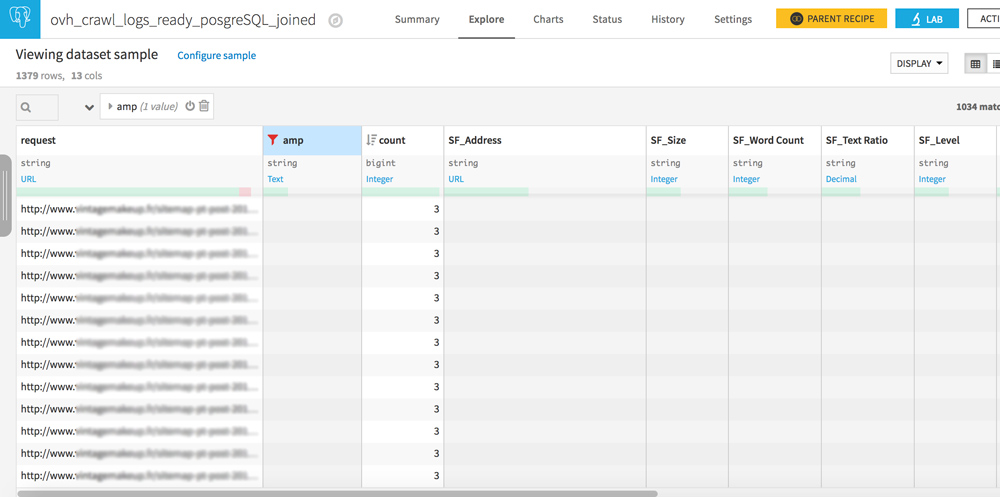
The column you just created now contains pieces of URLs including “amp” which we are particularly interested in here. To keep only “amp” and delete the contents of the other cells without erasing the lines, proceed as follows:
Click on a cell containing amp, and double-click on “Keep only rows containing amp” and then in the Script part on the left of the screen, select the “Clear non matching cells” action with amp.
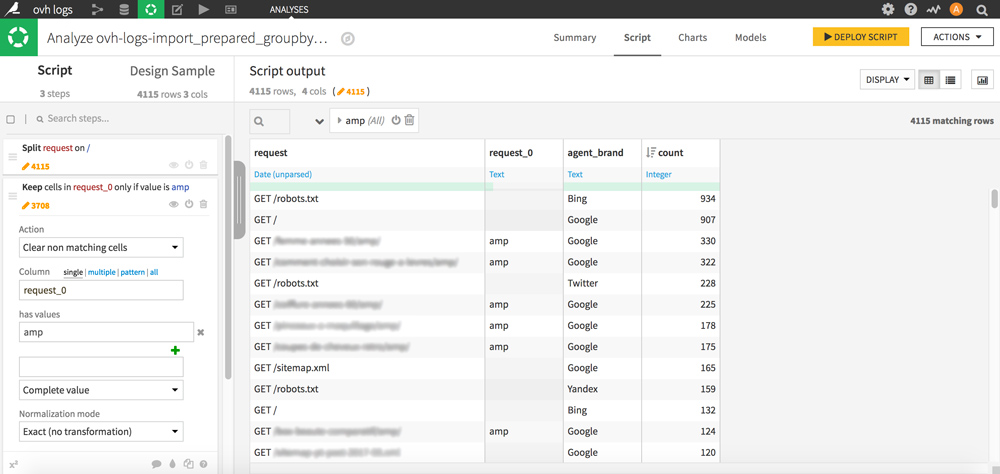
Your column is now cleaned and allows you to locate the rows of your dataset corresponding to amp pages at a glance, which will be very useful for filtering.
You can now filter the crawl hits per Bot (Google, Bing, Yahoo, etc.) and per page type (amp / non amp) and even sort the lines per number of hits for better readability.
Let’s go back to the Charts tab to see the distribution of the crawl on the AMP vs non-AMP pages.
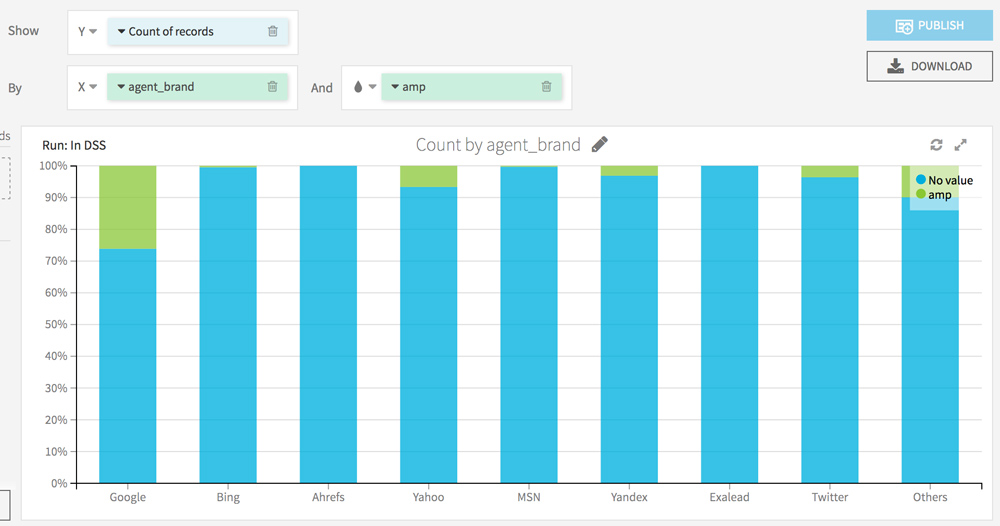
To go further, you can also enhance the visualization of filters: by category of page, by type of bot (mobile vs non mobile).
Cross server logs with crawl data from Screaming Frog
Run a crawl and server log analysis
A cross analysis will allow you to detect website’s areas where Googlebot does not come, and also ensure that it spends time on the right pages. It is a precious help to discover the orphan pages or spider traps.
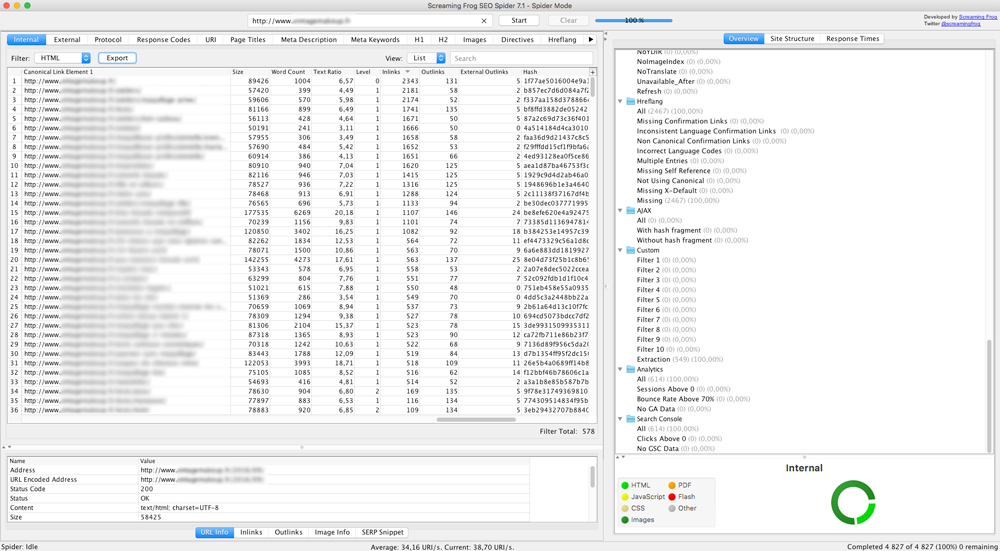
Start by crawling your website with Screaming Frog to retrieve your website’s onsite data for each URL (level, inlinks, size, etc.), filter the HTML and export the data in .xlsx format.
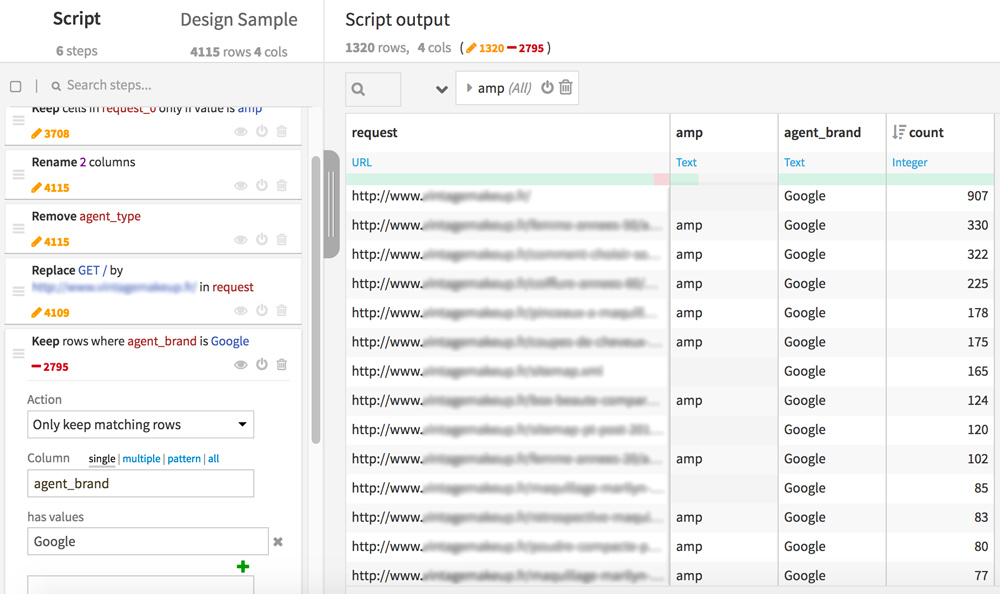
Go back to Dataiku DSS, re-open your previous dataset (the one with the 4 columns: request, amp, agent_brand, count). We’ll prepare it for the merge with the data from the crawl Screaming Frog. Now create a new Analysis.
In the “request” column, replace “GET /” with your domain names as it appears in your internal file of Screaming Frog. This step will allow us to match the lines between the 2 datasets .
For this analysis, you can also keep only the lines corresponding to GoogleBot (Keep rows where agent_brand is Google)
Click DEPLOY SCRIPT at the top right. A new page opens, click on RUN to create a new dataset based on your last treatments, we will call it “ovh_crawl_logs_ready”.
Let’s move to the merge.
Click + DATASET and upload your Screaming Frog file.
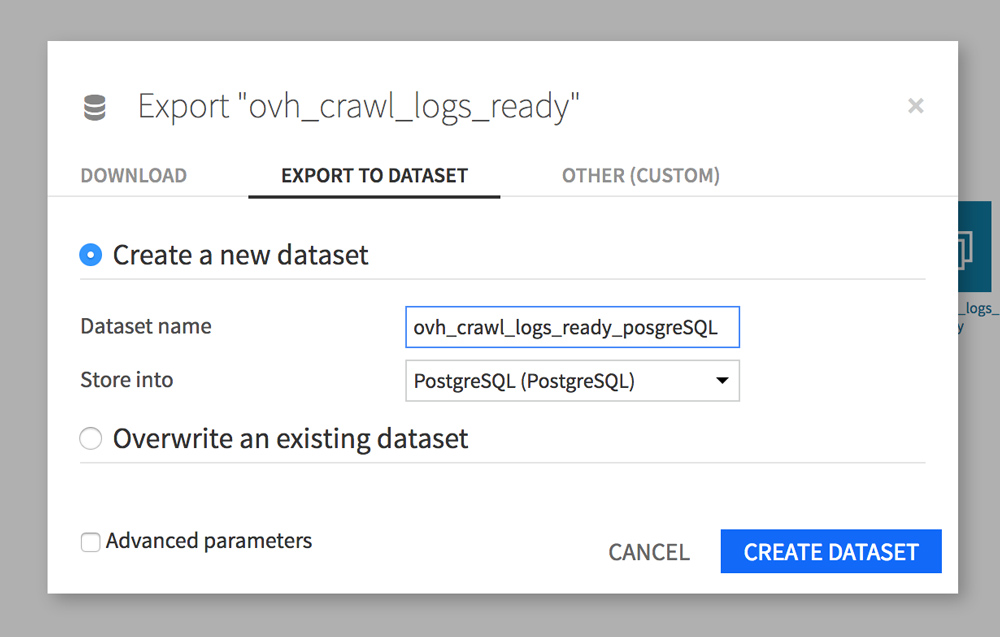
Before you can join the 2 files and keep all data from the 2 datasets, you must store them in a PostgreSQL SQL database as explained on Dataiku forum .
Click on your ovh_crawl_logs_ready dataset and then click Export (in the FLOW sidebar). A window opens, go to the EXPORT TO DATASET tab. Give your dataset a new name (ovh_crawl_logs_ready_postgresql), then choose Store in PostgreSQL.
Let’s do this again with your Screaming Frog dataset “internal_html”.
Once you have finished creating your PostgreSQL databases, click on your new “ovh_crawl_logs_ready_postgresql” dataset to bring up the FLOW sidebar.
In the Visual recipes area of the sidebar, click “Join with”.
A window appears. The value of First input dataset is “ovh_crawl_logs_ready_postgresql”. For the Second input dataset, choose internal_html_postgreSQL and click CREATE RECIPE. A new page appears.
Let’s move on to the merge setting.
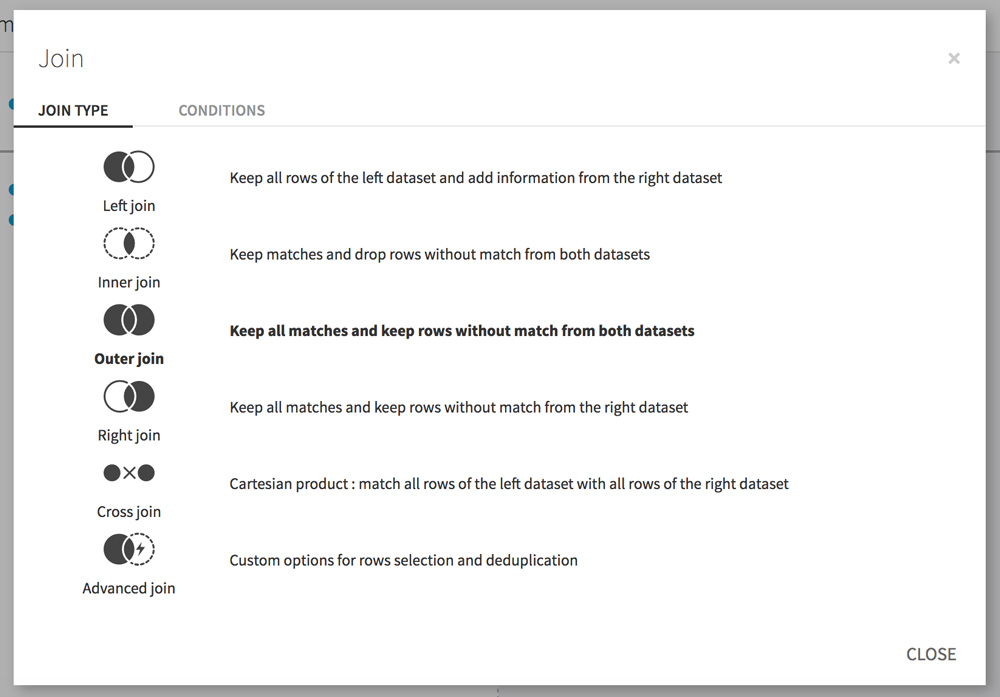
In the Join step, click the line that connects Address to request. A window appears. Click the JOIN TYPE tab and select Outer join to keep all the rows that match between the 2 datasets but also the lines that do not match.
This will allow us, for example, to discover the orphan pages (pages seen by the bots but not linked on the site) or the pages not crawled by Google while they are linked on the site.
To speed up the processing, we will filter some columns. To do this, go to the Selected columns step.
The most interesting data in your Screaming Frog file are in the Adress, Size, Word_Count, Text Ratio, Level, Inlinks, Outlinks, External Outlinks, Response Time columns. You can add a prefix (eg SF_) for easier reading in your future dataset.
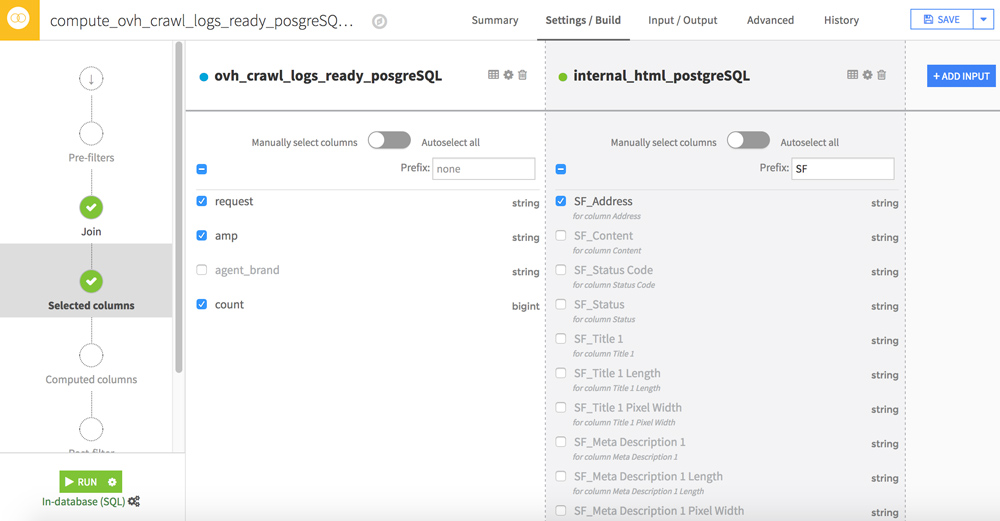
Click RUN to start merging the 2 datasets.
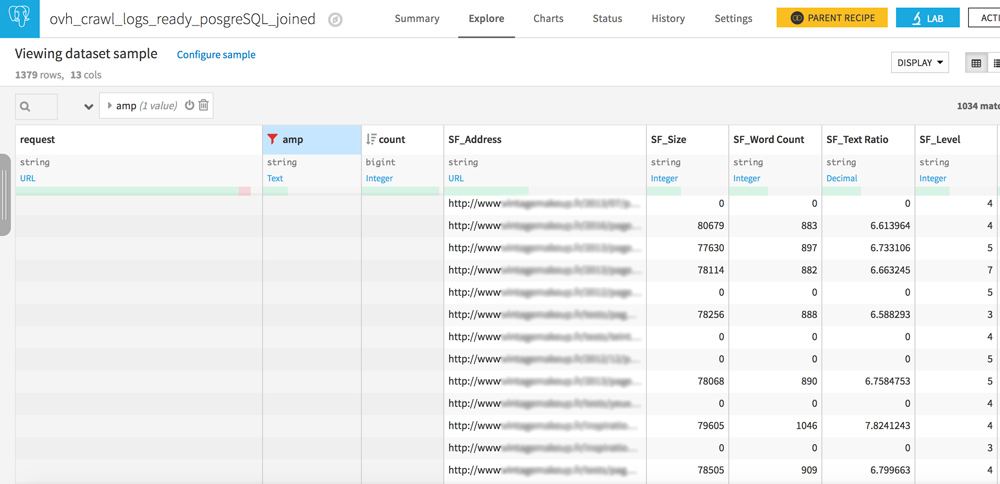
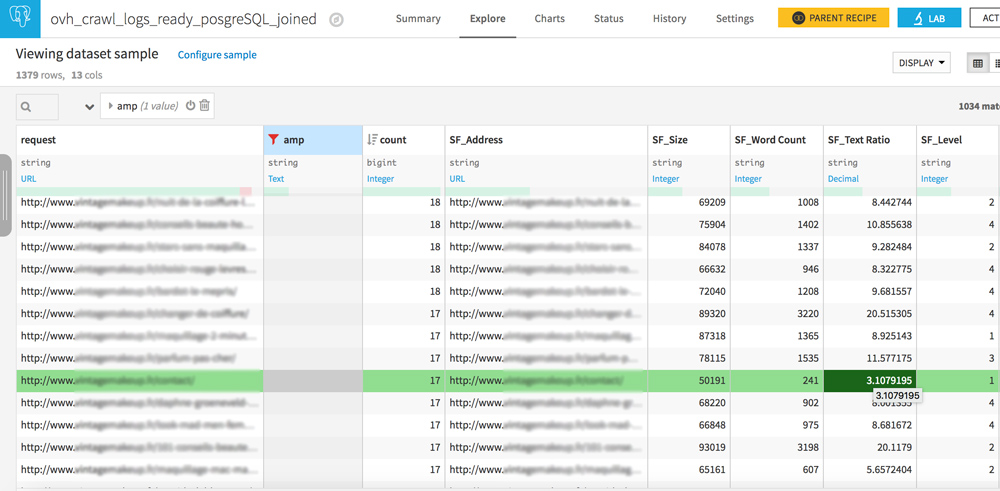
You are now ready for a cross logs / crawl analysis! Open your new dataset.
Orphaned pages and never-crawled pages
Your dataset has 2 similar columns: request and SF_Address.
Play with the filters to create the following 3 configurations:
- Request empty / URL in SF_Adress : pages never crawled but well linked on your site
- URL in request / URL in SF_Address : everything is OK, crawlers see pages that are well linked on your site
- URL in request / SF_Address empty : these are orphan pages, pages that are no longer linked to your site but that are still crawled by bots. If you have heard of crawl budget, reducing these pages should be part of your SEO strategy.
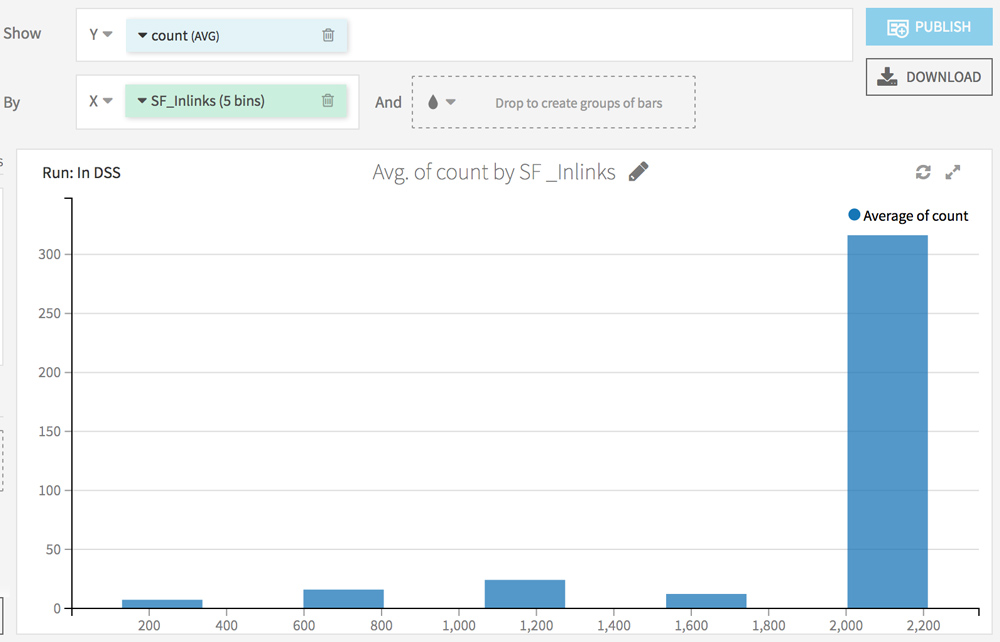
Find your own correlations between logs and crawl
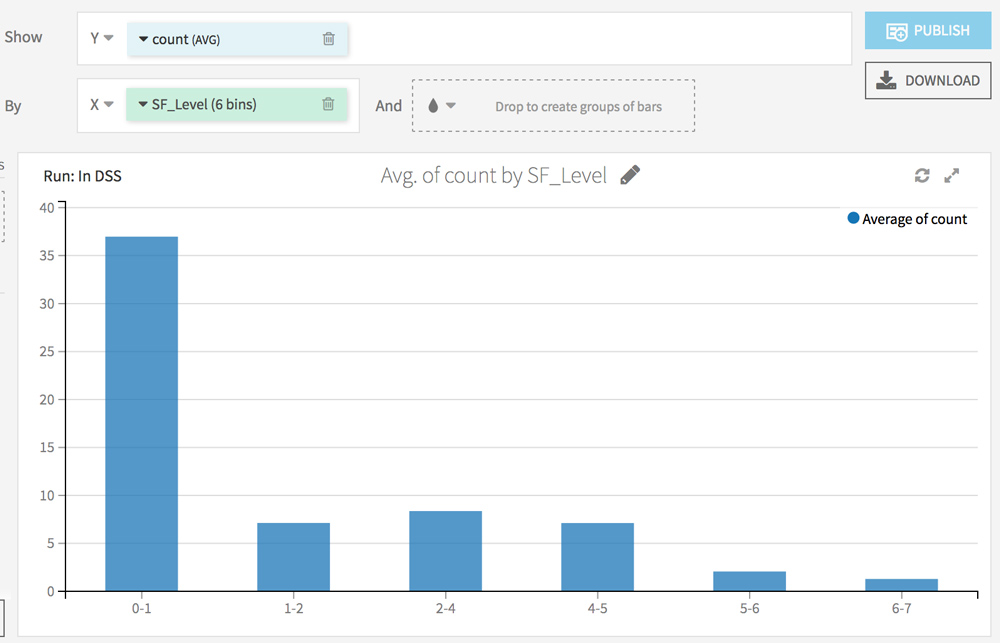
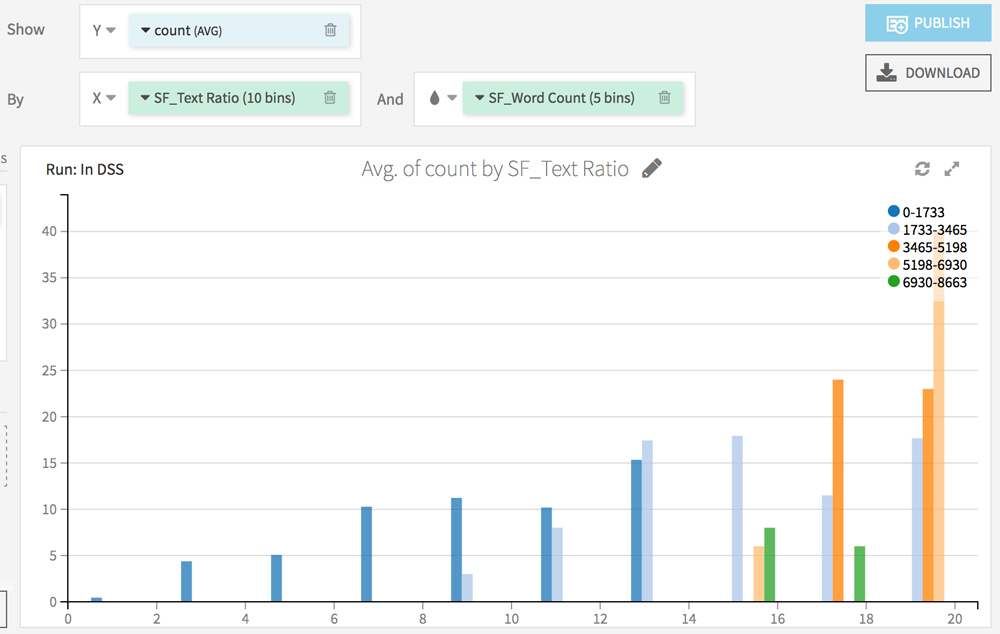
Go to the Charts tab. The goal here is to analyze the impact of each factor (from the Screaming Frog analysis) on the crawl frequency.
Choose count (AVG) on the Y axis and test different combinations on the X axis.
Here are some ideas:
What’s next?
The analyzes we have done so far are descriptive analyzes.
In a next post, we will use Dataiku DSS to make prediction using Machine Learning algorithms.
Do not hesitate to ask your questions in comments 😉 I will enrich the post according to your feedbacks!
Follow me on Twitter to be informed of the updates and next posts:
Follow @Remibacha